This blog post provides a summary of the Snowflake hands on lab: Attaining Consumer Insights with Snowflake and Microsoft Power BI. It provides details on using Snowflake to leverage Point of Sale data from 3rd party providers and send such data to Power BI for business analytics. The process is well suited to Business Intelligence Architects and Data Engineers who work within the Retail or Consumer Packaged Goods sectors.
The tutorial can be followed with free trials offered by Snowflake, Azure and Power BI (available as part of the Microsoft package).
Link to tutorial: https://quickstarts.snowflake.com/guide/attaining_consumer_insights_with_snowflake_and_microsoft_power_bi/#0
First Step: Migrating Lab Data to the Microsoft Azure Cloud Platform
- A blob storage account was created in Azure
- A blob container was then created to house the lab files
- A SAS token was generated to access the blob container
- A script file provided by Snowflake as part of the demo was loaded and run within the Azure Cloud Shell to copy the data from the original Git Repo source to the Azure Storage Account.
![]() Figure 1 – Running the scrip file to copy data from Git Repo to the Azure blob container
Figure 1 – Running the scrip file to copy data from Git Repo to the Azure blob container
What is blob container in Azure?
Azure Blob storage is Microsoft’s object storage solution for the cloud. Blob storage is optimized for storing massive amounts of unstructured data. Unstructured data is data that doesn’t adhere to a particular data model or definition, such as text or binary data [1]
At this stage, there was the opportunity to utilize Azure Storage Explorer to manage cloud storage resources from the desktop.
Second Step: Preparing to Load Data & Loading into Snowflake
The first step is to specify the role ACOUNTADMIN within Snowflake to be used for the workshop. Snowflake’s roles control access privileges to objects within Snowflake.
Following this, two warehouses are created named ELT_WH and POWERBI_WH, with the access granted to SYSADMIN. A warehouse for each workload prevents contention between the operations each warehouse is performing. The warehouses are configured to auto suspend and resume – this is a key benefit of snowflake as this prevents the use of unnecessary computation.
The next step includes creating tables for the data to fill once it is loaded to Snowflake from the Azure Blob Storage Container: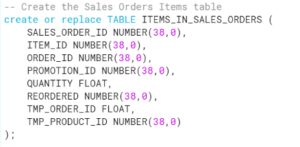 An external stage is then created to the Azure Blob Storage Container – this acts as a link between the stored data and the Snowflake platform.
What is external stage in Snowflake?
An external stage specifies where data files are stored so that the data in the files can be loaded into a table [2]
A file format is then created for the data to load into: Figure 3 – Creating a file format for csv files
Files can then be loaded and checked to ensure the data is loading as expected: Figure 4 – Loading files from the external data stage using the defined file format
Warehouse Size
In Snowflake it is possible to vary the warehouse size to speed up performance – this referred to as scaling up. With an X-SMALL warehouse it is possible to load the 200 million sales orders and 1.8 billion sales order items in a couple of minutes. The speed increases to process the records within seconds when scaled to a X-LARGE warehouse.
The key benefits of using Snowflake for this task include the ability to create, scale up, and out, and auto suspend and resume warehouse operations within a small timeframe. Other providers often require significant configuration to perform such operations.
Aggregations
Aggregations can be performed within Snowflake to improve performance once the data is loaded into Power BI. This is especially beneficial in this instance when there are billions of rows of data.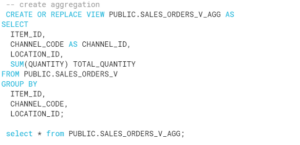 Figure 5 – Creating an aggregation by item_id, channel_code, location_id
Connecting Snowflake to Power BI
Once Power Bi is opened, the Get Data Command can be used to connect to a Snowflake data source.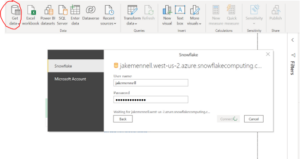 Figure 6 – Connecting to the snowflake data source
Data can then be connected via a DirectQuery – this means there is a live connection to the data source and not a copy saved to the computers cache. This is beneficial when dealing with big data databases.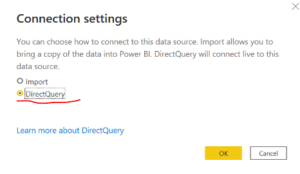 Figure 7 – Selecting a DirectQuery to Snowflake
Visualisation
It is then easy to provide business analytics through the visualization tools offered by Power BI. The below bar chart visual summarises the count of items by department. The tiles provide summary statistics on the price of items for sale.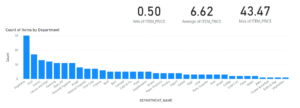 Figure 8 – Visualisations of the data
Conclusions
This blog post has demonstrated the simplicity of Snowflake to create stages, user roles, databases, tables, and warehouses. Additional steps include the ability to sync data with power BI for business analytics and visualisation. Further steps which could be undertaken that are detailed in the workshop, include performing optimisation techniques to speed up report/dashboard responsiveness. This could be done by creating a composite data model that includes snowflake generated aggregations.
References
[1] https://docs.microsoft.com/en-us/azure/storage/blobs/storage-blobs-introduction[2] https://docs.snowflake.com/en/user-guide/data-load-s3-create-stage.html


