30 Oct 23
Exploring the Intersection of Biomedical Engineering and Data Science

Annalisa Smith
My aim for this blog is to uncover for you the world of data science within the field of biomedical engineering as I have discovered it through my master’s degree at the University of Surrey.
Let’s begin by understanding a bit about what BME is and what it is a biomedical engineer does.
What does a Biomedical Engineer do?
This question has come my way countless times during my four years as a student. Frankly, more often than not, I found myself without a clear and concise response.
From my perspective, in BME, they act as the bridge between medicine and engineering. They leverage their skills to design, develop, and innovate medical solutions.
These solutions span from diagnostic tools to prosthetics, all with the overarching goal of enhancing patient care and quality of life.
BME: Initial Fascination and Evolving Perspectives
My interest in the BME field began during my A-levels when I was captivated by the notion of designing prosthetics. Yet, as I delved into my studies, I discovered that my passion didn’t align as expected. The intricacies of using CAD (computer-aided design) proved more challenging than anticipated.
Nonetheless, I pressed on, optimistic that a future module would reignite my enthusiasm for the course.
My Encounter with MATLAB
My first encounter with MATLAB, a software we needed to use within my BME coursework didn’t leave the best impression. It was during my second year, in a module on numerical methods, where we used MATLAB to tackle complex mathematical equations, showcasing the potential of computers in these computations. Unfortunately, this experience falsely led me to believe that all computer programs required any formulas or equations you needed to be written out from scratch when you needed them!
Fortunately, MATLAB re-entered my academic journey in my third year, through a module focused on “biomedical signal processing” in my BME coursework. I remember my lecturer stating that “most students end up enjoying MATLAB more by the end of this module.” Sceptical at first, I found myself resonating with that sentiment after a few classes and practical tutorials. My perception shifted, and I grew to love working with MATLAB.
In this module, I gained insights into utilizing pre-built libraries (farewell, hand-typed equations!) and crafting for-loops. Additionally, I deepened my understanding of electroencephalograms (EEGs), exploring how raw data can be transformed into meaningful frequency data. These foundations in BME paved the way for my final year project.
Exploring EEG Analysis and machine learning in MATLAB
My final year project, titled “Differential Diagnosis of Epilepsy and Psychogenic Non-Epileptic Seizures (PNES) from Electroencephalograms using Machine Learning” centred on leveraging machine learning to identify crucial features within brain scans of patients with these disorders, aiding diagnosis.
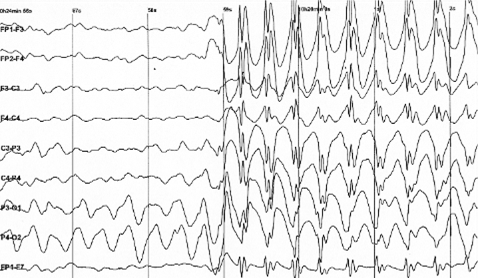
Figure 1 EEG – Wikipedia
Given the appearance of a typical EEG (as depicted in Figure 1), it is evident that only experienced clinicians can accurately identify abnormalities in these graphs. Hence, the task of a BME in this situation is to employ diverse techniques to uncover concealed information within raw data.
The BME Process
The basic steps I followed are clearly represented in the flow chart below.
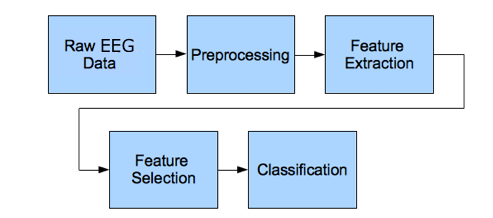
Figure 2 EEG data analysis flowchart – Neuroelectrics.com
RAW EEG DATA
I had access to recorded scans, provided in a CSV format, allowing for straightforward loading into MATLAB. Each column represented an electrode, while each row encapsulated an epoch of data. The commonly used sampling rate is 256Hz, making each row equal to 1/256s of data. With data from around 50 patients, evenly split between those with epilepsy and PNES, I used my knowledge of BME to go on a journey of analysis.
PREPROCESSING
Prior to delving into feature extraction, data cleansing was essential. Not all data adhered to the 256Hz rate, necessitating resampling for standardization. EEG recordings often incorporate the main frequency component (50Hz) due to powered apparatus. Removing this interference was feasible via a high-pass filter. However, in the EEG study, the focus rarely exceeds 30Hz, prompting me to eliminate frequencies beyond this range. This phase of BME was time-consuming, involving iterative refinement to achieve the desired data structure while addressing various noise and anomaly sources.
FEATURE EXTRACTION
Unveiling insights from EEGs involved employing both linear methods (Fourier transform, wavelets) and non-linear methods (entropy, Lempel-Ziv complexity). These techniques transformed raw data into interpretable forms, revealing hidden information. Fourier transform facilitated a transition into the frequency domain, enabling segregation into distinct brain wave ranges (delta 1-3Hz, theta 4-8Hz, alpha 8-12Hz, and beta 13-30Hz). Non-linear methods, encompassing complexity algorithms, have been shown to unearth significant EEG features for classification.
CLASSIFICATION
Equipped with extracted features, the time came to apply machine learning algorithms to identify key differentiating elements for the disorders. MATLAB’s built-in algorithms streamlined the process, requiring only input features and relevant parameters. Before classification, algorithms need training on a subset of the data to ‘learn’ the trends. I allocated 30% of my data for training, reserving the remaining 70% for testing.
To gauge the algorithm’s accuracy, a confusion matrix is often used (see Figure 3 below). This matrix tallies True Positives (TP), True Negatives (TN), False Positives (FP), and False Negatives (FN) in order to calculate accuracy and precision. In my context, I selected epilepsy as the true class, while PNES represented the false class. Maximising TP and TN is the ideal goal, with a True Positive indicating accurate classification of epilepsy features and a True Negative reflecting correct classification of not-epilepsy (PNES).
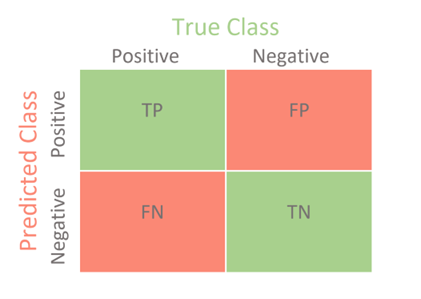
Figure 3 Confusion matrix – Towards Data Science
RESULTS
Exploring different machine learning algorithms on feature subsets led me to identify the highest-performing algorithm for this use case. While not achieving 100% accuracy, this algorithm showcased improvement over traditional diagnostic measures, demonstrating promise in future use for differential diagnosis. Currently, this method is used mainly for Alzheimer’s diagnosis but is continuing to show promise for other medical diagnoses such as epilepsy.
Conclusion
My BME project was an immensely enjoyable experience, reinforcing my aspiration to apply my degree in a career where data from medical devices can be harnessed and analysed to unveil insights that otherwise would not have been found without, contributing to the deeper understanding of an individual’s health.
Interested in joining our diverse team? Find out more about the Rockborne graduate programme here.
Related posts
Life at Rockborne20 Jun 25
Federated Learning: The Future of Collaborative AI in Action
Federated Learning: The Future of Collaborative AI in Action The way we build, deploy, and govern AI is evolving, and so are the expectations placed on organisations to do this...
09 Sep 24
Tips to Succeed in Data Without a STEM Degree
By Farah Hussain I graduated in Politics with French, ventured into retail management, dabbled in entrepreneurship, a mini course in SQL and now… I am a Data Consultant at Rockborne....
Farah Hussain
15 Apr 24
Game Development at Rockborne: How is Python Used?
Just how is Python used in game development? In this blog post, we see the Rockborne consultants put their theory into practice. As the final project in their Python Basics...